Overview
Data visualization has never been simpler on Insense! Our performance dashboard allows you to see real-time information on both your platform usage and your campaigns.
Do you need to track the performance of your latest posting campaign or check how much money you spent for a specific brand? You can find that and more on the performance dashboard:
What information is available for me?
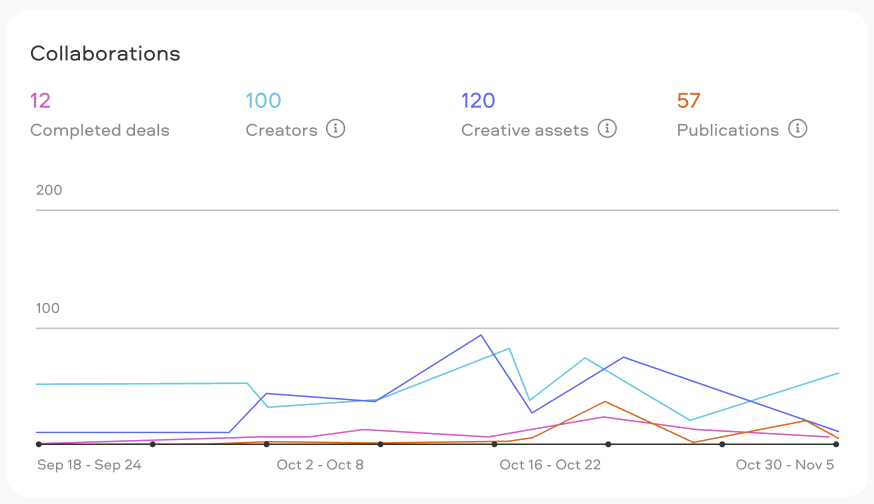
Collaborations
This graph will display the information related to the collaborations you are running with creators on the platform. It will display information such as:
-
Total completed deals
-
Unique creators you've collaborated with
-
Total creative assets delivered
-
Publications made by creators
Views (only available if posting campaigns have been launched)
This graphic will display how the posts made by creators have performed in terms of views and reach. It will display the total views, which is the sum of the views and impressions on different platforms:

Engagement & ER (only available if posting campaigns have been launched)
This graphic will display how the posts made by creators have performed in terms of engagement. It will display information such as:
-
Engagement
-
Likes
-
Comments
-
Shared
-
Saved

CPM & CPE (only available if posting campaigns have been launched)
This graphic will display how the posts made by creators have performed based on the values of CPM and CPE respectively.

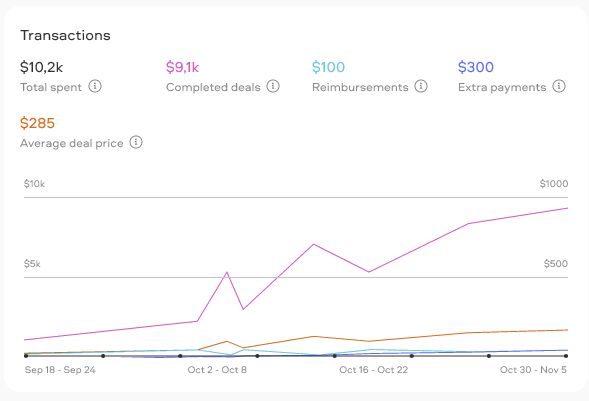
Transactions
This graph will display the information related to financial transactions on the platform. It will display information such as:
-
Total amount spent
-
Total spent on completed deals
-
Total spent on reimbursements
-
Total spent on extra payments
-
Average deal price
What filters are available?
Not only, the performance dashboard allows you to see all of this information, but it also gives you more than enough flexibility to filter it and visualize it however you want.
Here are the options you have available for you:
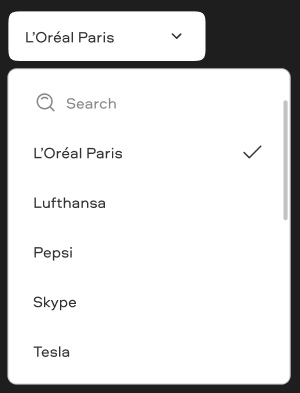
Filter by brand
Which allows you to choose up to 1 brand for the dashboard to display the information on. You can also use the search bar to look for a specific brand:
Filter by Campaign
Which allows you to choose 1 or more campaigns for the dashboard to display the information on. You can use the search bar to look for any specific campaigns:

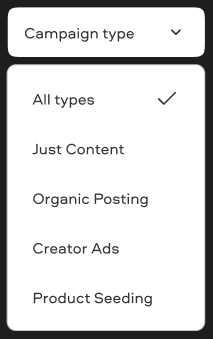
Filter by Campaign Type
Which allows you to choose the campaign type you want the dashboard to display information for:
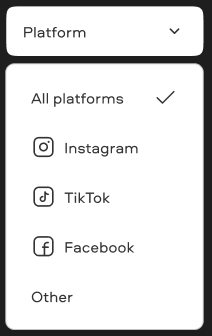
Filter by Platform
Which allows you to choose the platform you want the dashboard to display information for:
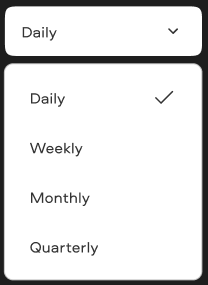
Data Periodicity
Which allows you to select the periodicity of how the data on each graph will be displayed:
Filter by start/end date
Which allows you to choose a start and end date for the data that will be displayed on each graph:

We're here to help! For any further assistance, click the chat bubble in the bottom corner and send us a message. Or feel free to reach out to us at hello@insense.com.
We're just a message away!